checkmate-with-data
A data-driven analysis of my personal chess journey on chess.com
Checkmate with Data: A Quantitative Analysis of Personal Chess Performance
1. Project Motivation
During the Summer of 2025, I dedicated significant time to playing Rapid Chess on Chess.com. Like many amateur players, I experienced periods of rapid improvement followed by frustrating stagnation. I often relied on intuition to assess my play (“I feel like I play worse at night,” or “I think I’m bad with Black pieces”).
The goal of this project is to replace intuition with evidence. By building a full Data Science pipeline—from API extraction to Statistical Inference—I aim to uncover the hidden patterns in my game history, quantify my weaknesses, and derive actionable insights to reach the next ELO milestone.
2. Data Pipeline & Methodology
2.1 Data Acquisition
- Source: Chess.com Public API.
- Tooling: Python script (
scripts/01_fetch_data.py) usingrequestsfor API calls andchess.pgnfor parsing game moves. - Volume: 500+ games collected.
2.2 Data Cleaning & Filtering
To ensure statistical validity, the raw data required significant preprocessing:
- Game Mode Filtering: The dataset contained a mix of Blitz, Bullet, and Daily games. To ensure rating consistency, I filtered strictly for Rapid (10 min clock) games.
- Timeframe: Filtered for games played post-June 2025 to focus on the “Summer Journey.”
- Feature Extraction: Parsed raw PGN strings to extract specific opening names (e.g., “Scotch Game”) and move counts.
- Timezone Adjustment: Converted Unix timestamps to local time to analyze circadian rhythms in performance.
3. Exploratory Data Analysis (EDA)
3.1 Performance Evolution (Time Series)
Objective: Visualize the progression of ELO rating over time and identify improvement phases.
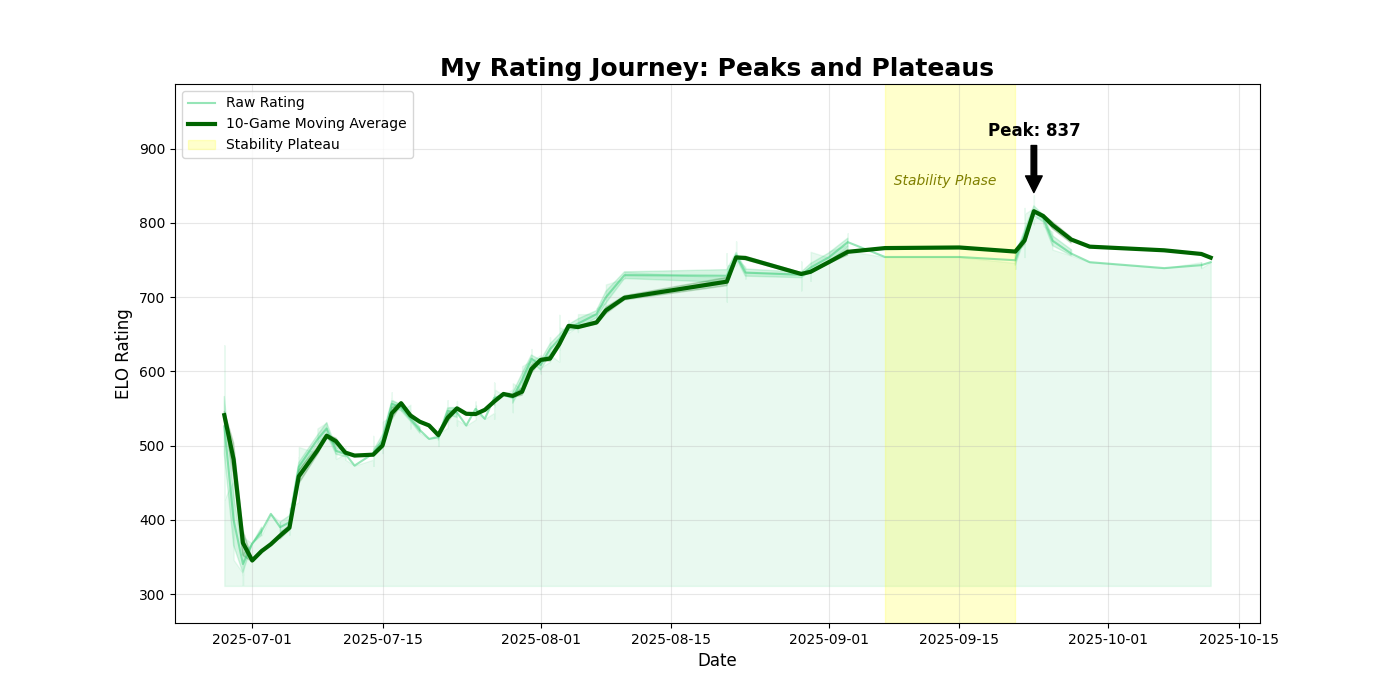
Insights:
- The Rust Phase (July): The initial dip indicates a period of re-learning mechanics.
- The Stability Plateau (Sept 7 - Sept 21): Highlighted in yellow. I stopped playing chess for a while during this time period.
- The Peak: Reached an all-time high of 837 in late September.
3.2 The “White Advantage” (Color Analysis)
Objective: Determine if playing White provides a significant competitive edge.
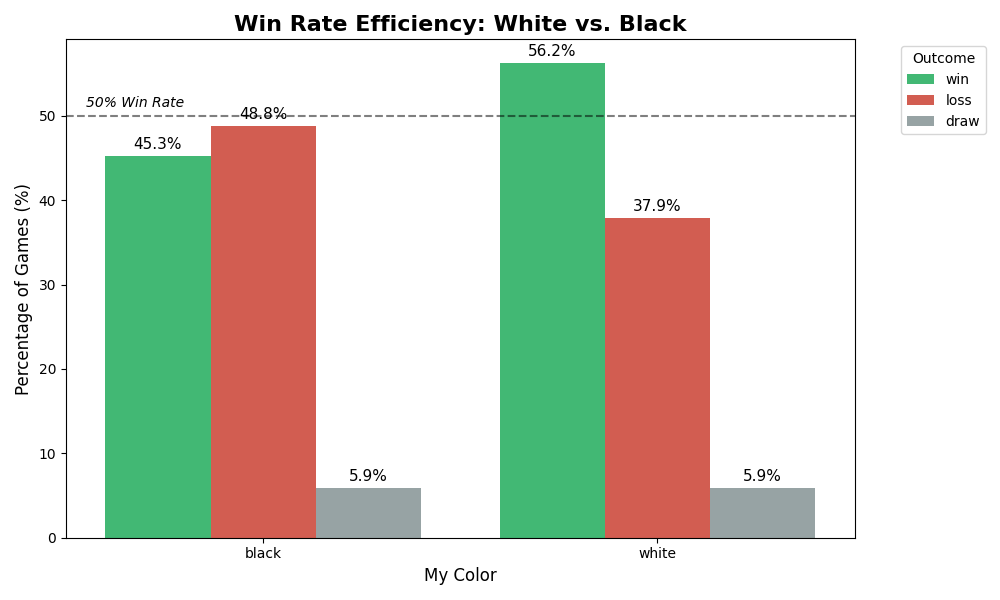
Insights:
- White Win Rate: ~56.6%
- Black Win Rate: ~45.0%
- Conclusion: There is a massive 11.6% performance gap. My defensive repertoire with Black is a primary bottleneck for future progress.
3.3 Opening Repertoire Strategy
Objective: Identify the most successful openings and those that need abandonment.
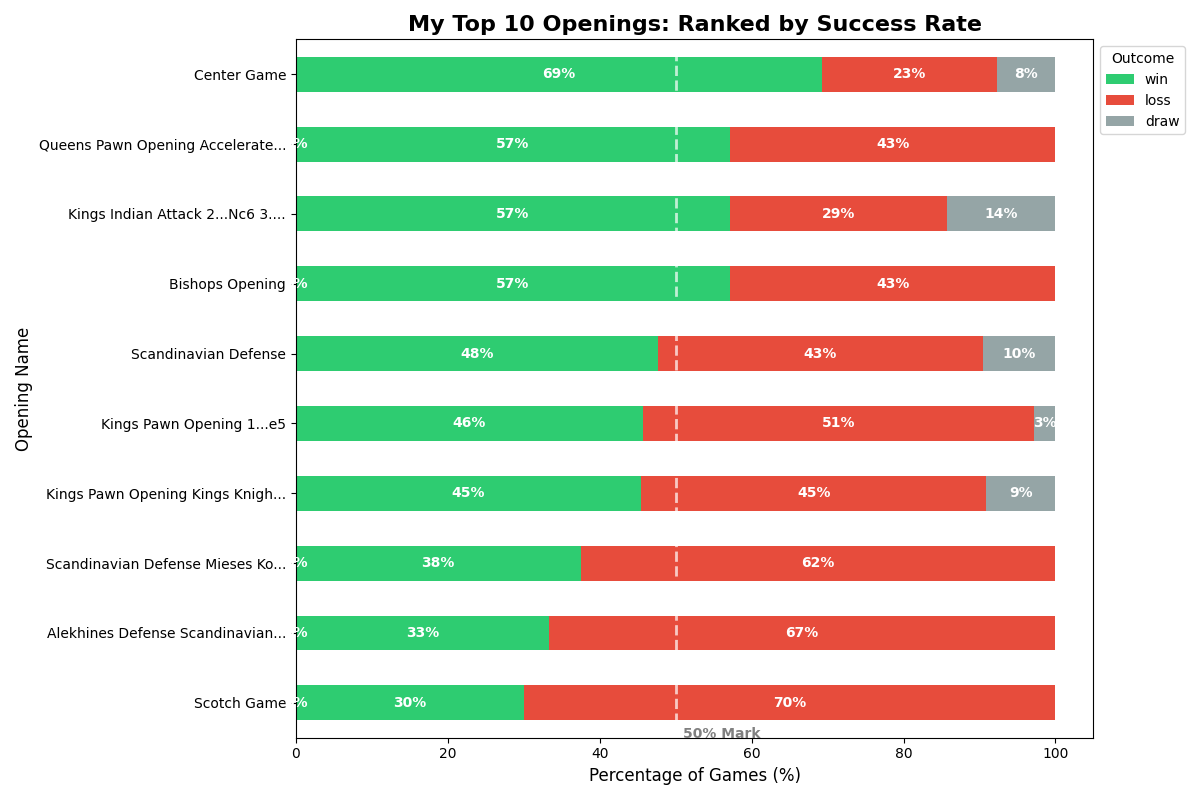
Actionable Takeaways:
- The “Center Game” (69% Win Rate): This is my most effective weapon. I should actively steer games toward this structure.
- The “Scotch Game” (30% Win Rate): I consistently lose with this opening. It is statistically detrimental to my rating and requires immediate study or abandonment.
3.4 Circadian Rhythms & Fatigue
Objective: Correlate playing volume with win-rate efficiency.
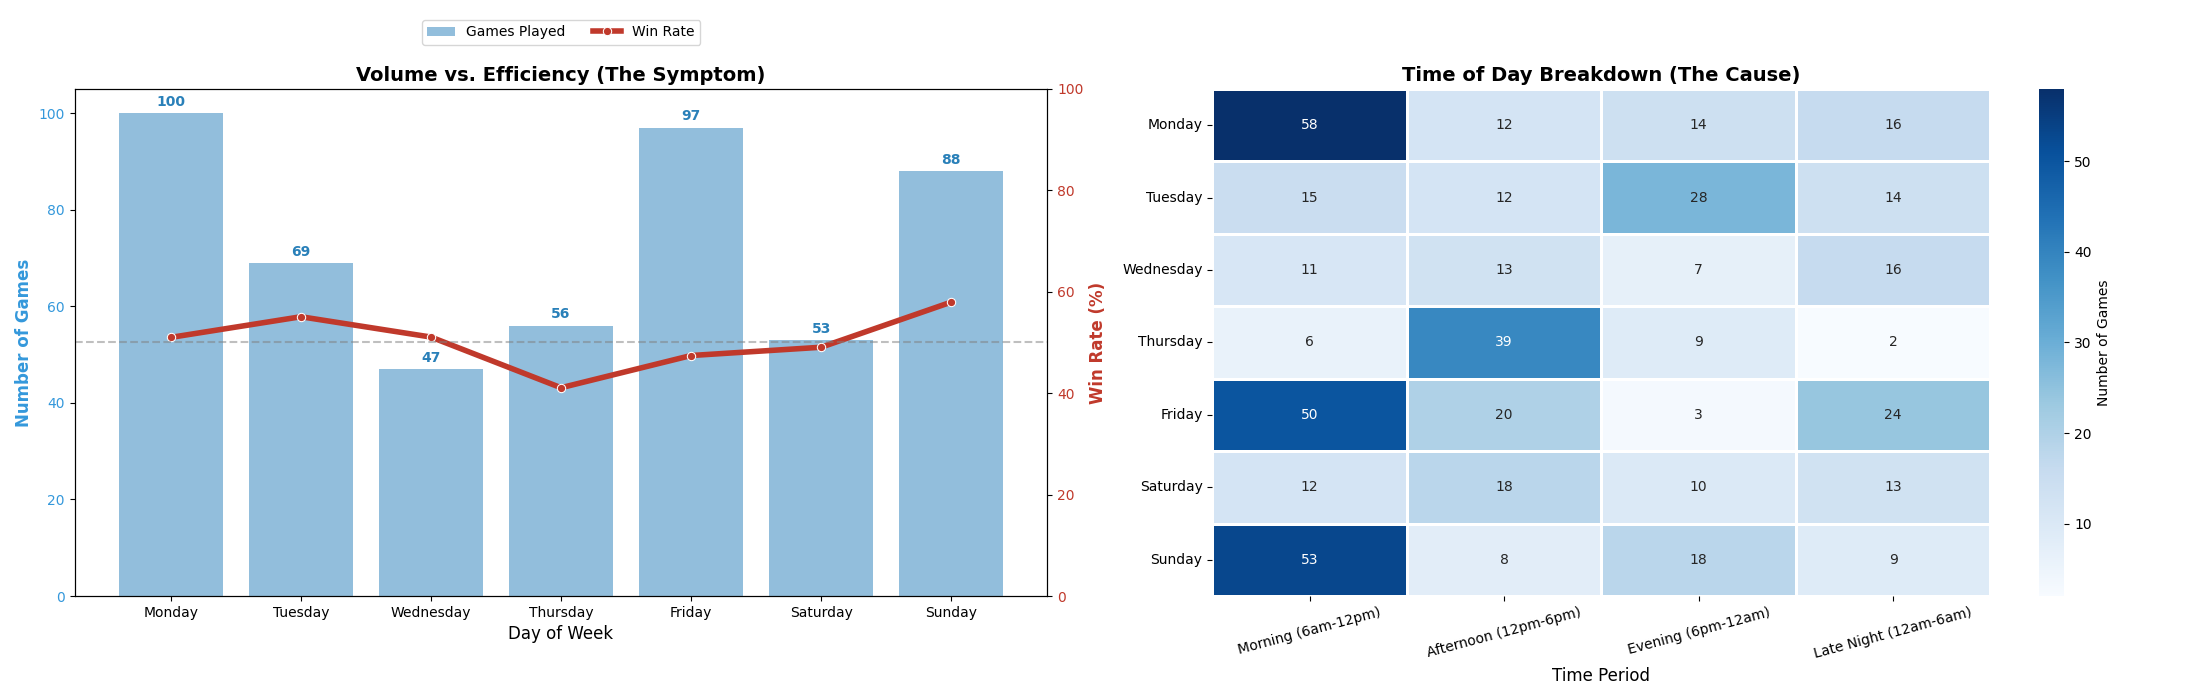
Insights:
- The Friday Slump: Friday is a high-volume day (100+ games), but efficiency drops to ~50%. The Heatmap (right) reveals this volume is concentrated in Late Night (12 AM - 6 AM) sessions, suggesting fatigue significantly degrades decision-making.
- The Sunday Peak: Sunday shows the highest win rate. Activity is concentrated in the Morning, confirming that I play best when rested.
4. Statistical Hypothesis Testing
To ensure the findings above weren’t just random variance, I performed formal statistical tests (scipy.stats and statsmodels).
Test 1: The First Move Advantage
- Null Hypothesis ($H_0$): Win Rate (White) $\le$ Win Rate (Black).
- Alternative ($H_1$): Win Rate (White) > Win Rate (Black).
- Test Used: Two-Proportion Z-Test.
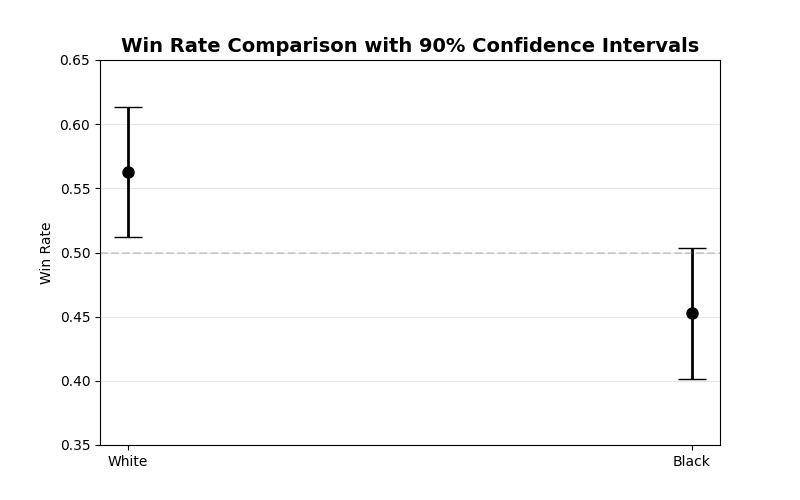
Results:
- P-Value:
0.0066 - Confidence Intervals (90%): The intervals for White and Black do not overlap.
- Conclusion: Reject $H_0$. The advantage for White is statistically significant at $\alpha=0.05$.
Test 2: Game Duration Dynamics
- Question: Do winning games end faster than losing games?
- Methodology:
- Visual: Boxplot to observe distributions and outliers.
- Statistical: I employed a dual-test approach to ensure robustness:
- Independent T-Test: Compares the Means. (Sensitive to outliers).
- Mann-Whitney U Test: Compares the Medians. (Robust to outliers/non-normal distributions).
- Reasoning: Chess game lengths are often right-skewed (most are short, a few are very long). If the T-Test and U-Test agree, the result is confirmed regardless of data shape.
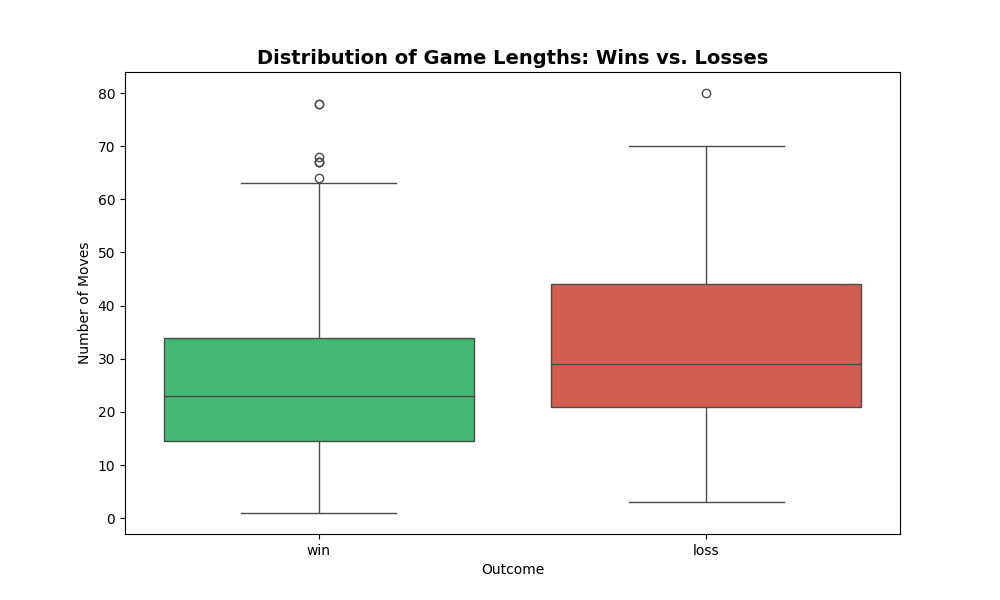
Results:
- T-Test (Means): $t = -4.75$, $p = 0.0000027058$
- Mann-Whitney U (Medians): $U = 21130.5$, $p = 0.0000007606$
Conclusion: Both tests returned $p \approx 0$, leading to a Strong Rejection of the Null Hypothesis.
- Insight: My winning games (Mean ~26 moves) are consistently shorter than my losing games (Mean ~33 moves). This confirms a tactical playing style where wins come from early advantages, whereas losses tend to drag out into long, grinding endgames.
5. Predictive Modeling (Machine Learning)
The Challenge: Can AI predict if I will win based only on the board state at Move 15?
- Constraint: I removed
Rating Differencefrom the training data to force the model to judge the position, not the players.
5.1 Model Comparison
I compared a linear baseline against complex tree-based models using 5-Fold Cross-Validation.
- Logistic Regression: ROC-AUC = 0.714
- Tuned XGBoost: ROC-AUC = 0.690
- Tuned Random Forest: ROC-AUC = 0.654
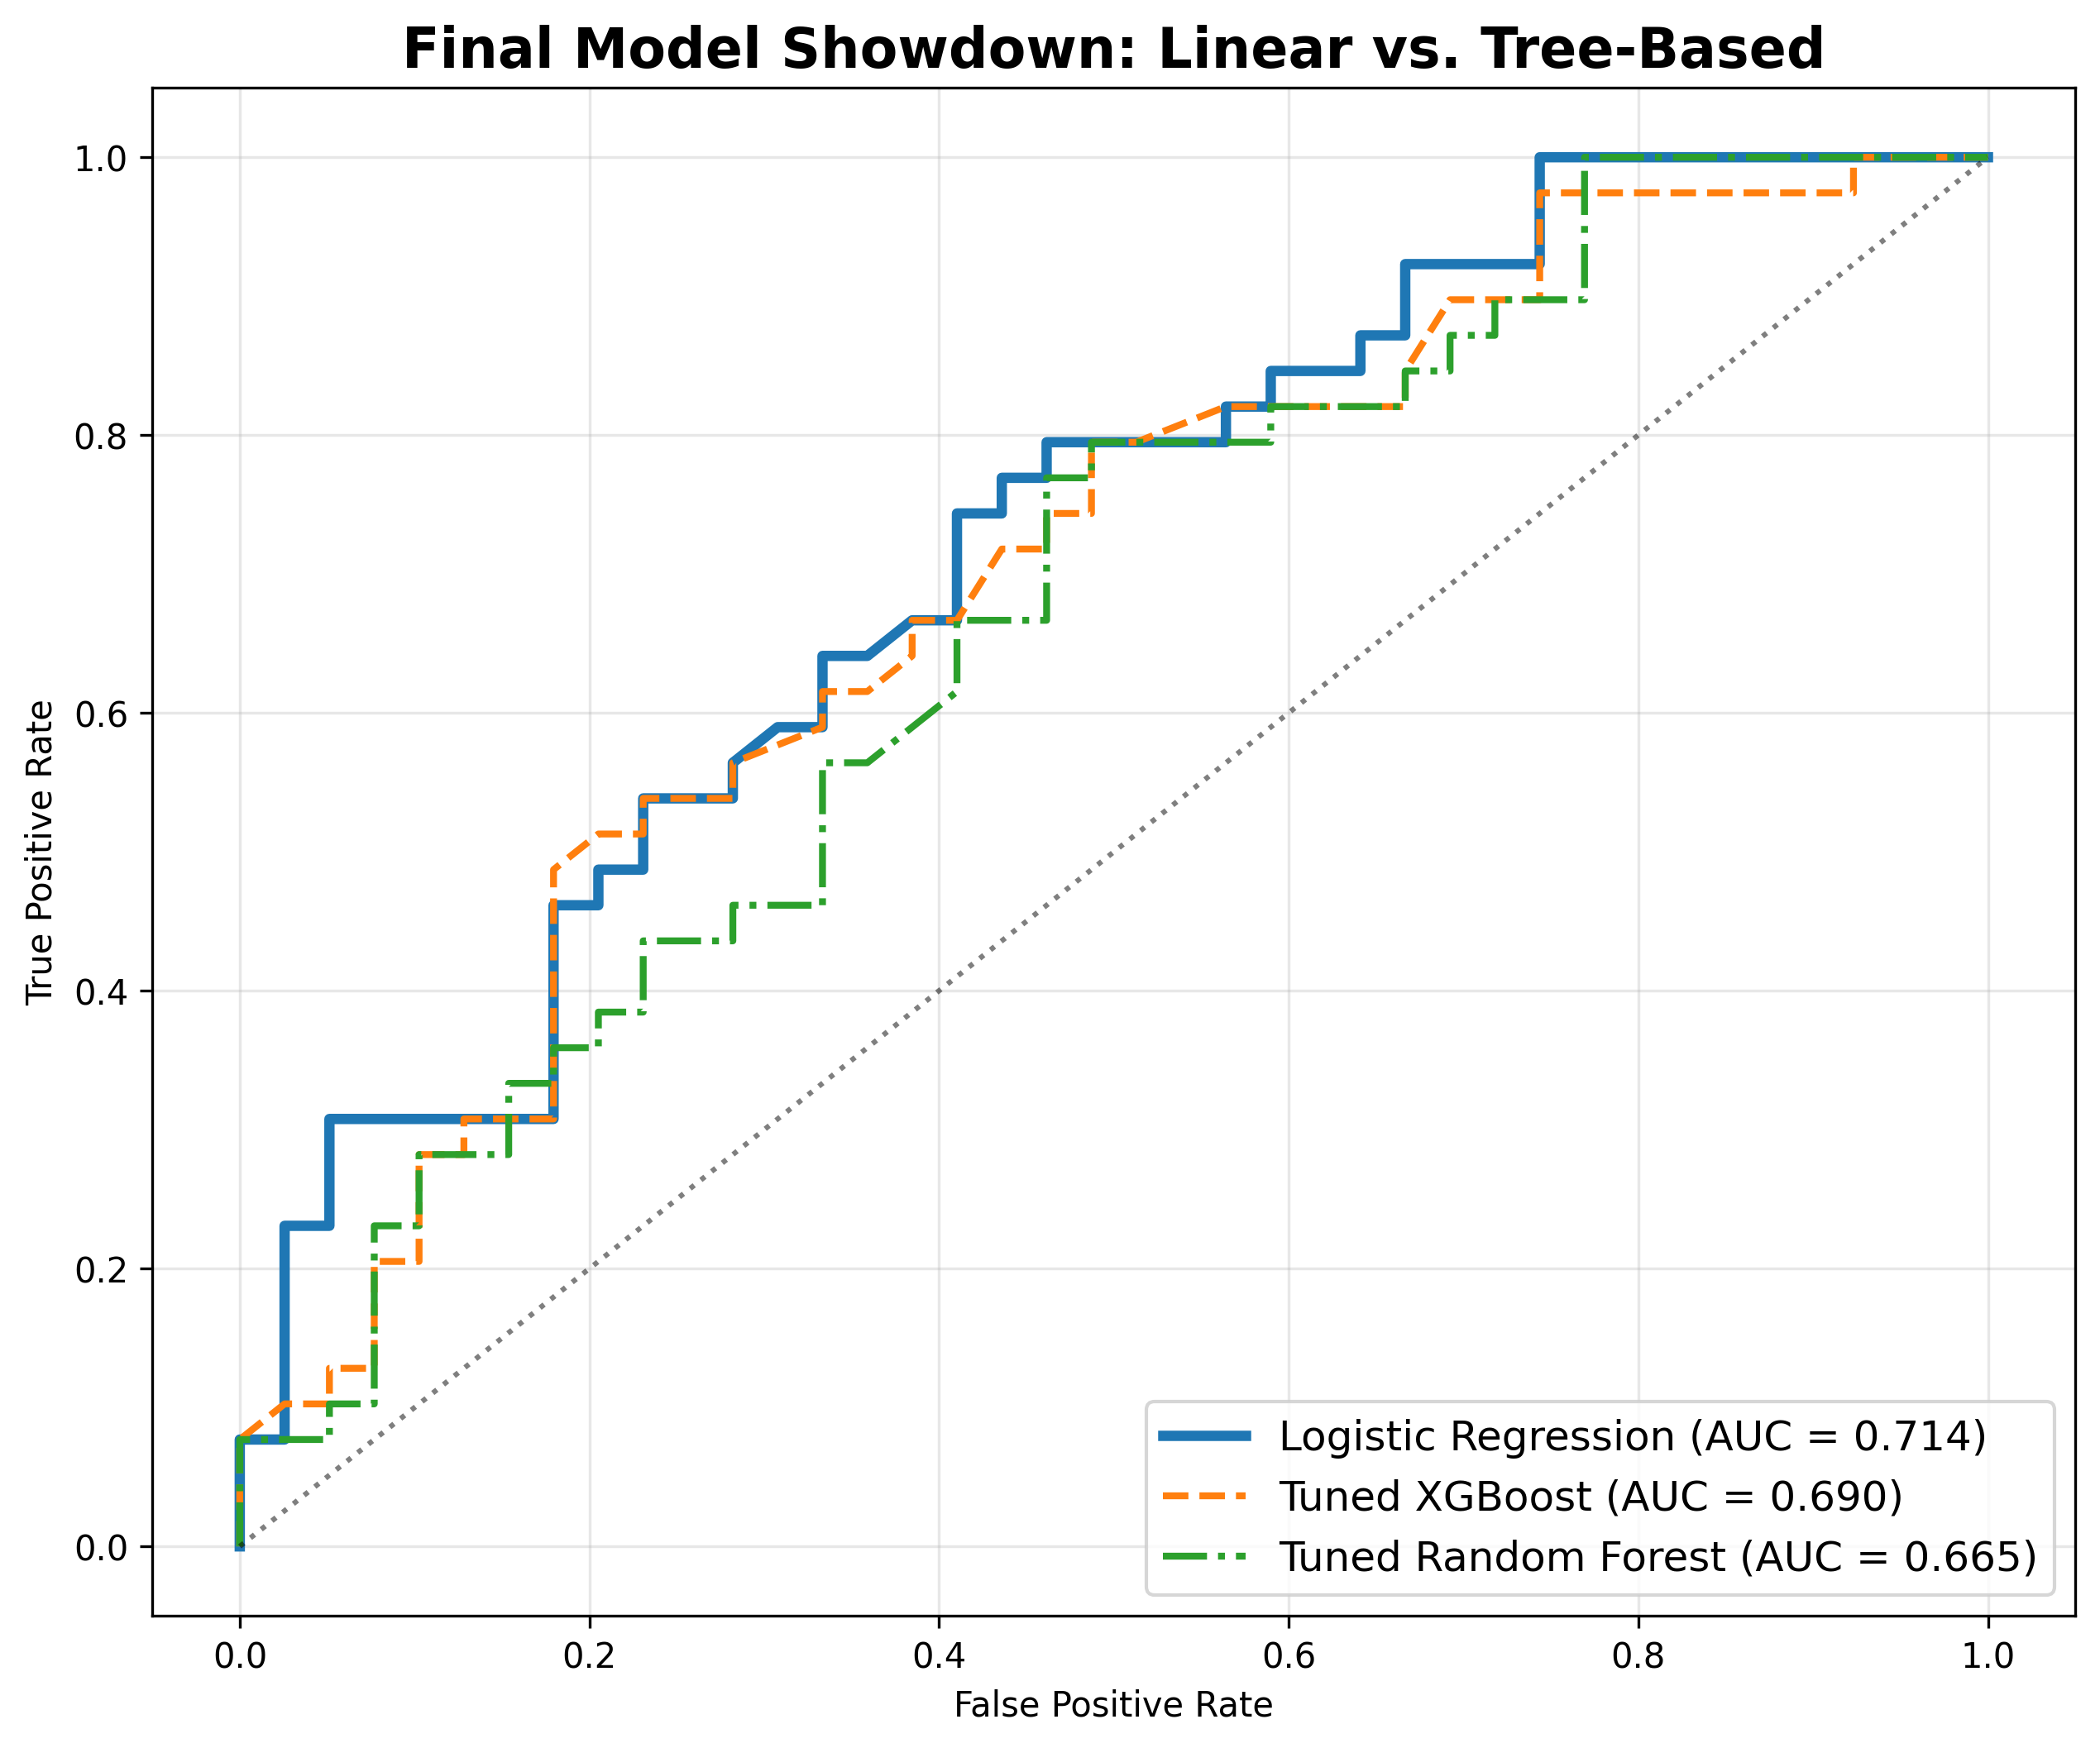
Conclusion: The simpler model (Logistic Regression) won. This implies that my games are decided by linear, cumulative advantages (Material + Mobility) rather than complex, non-linear positional nuances that tree models look for.
5.2 What Drives a Win?
The Logistic Regression coefficients reveal the “Equation of Victory”:
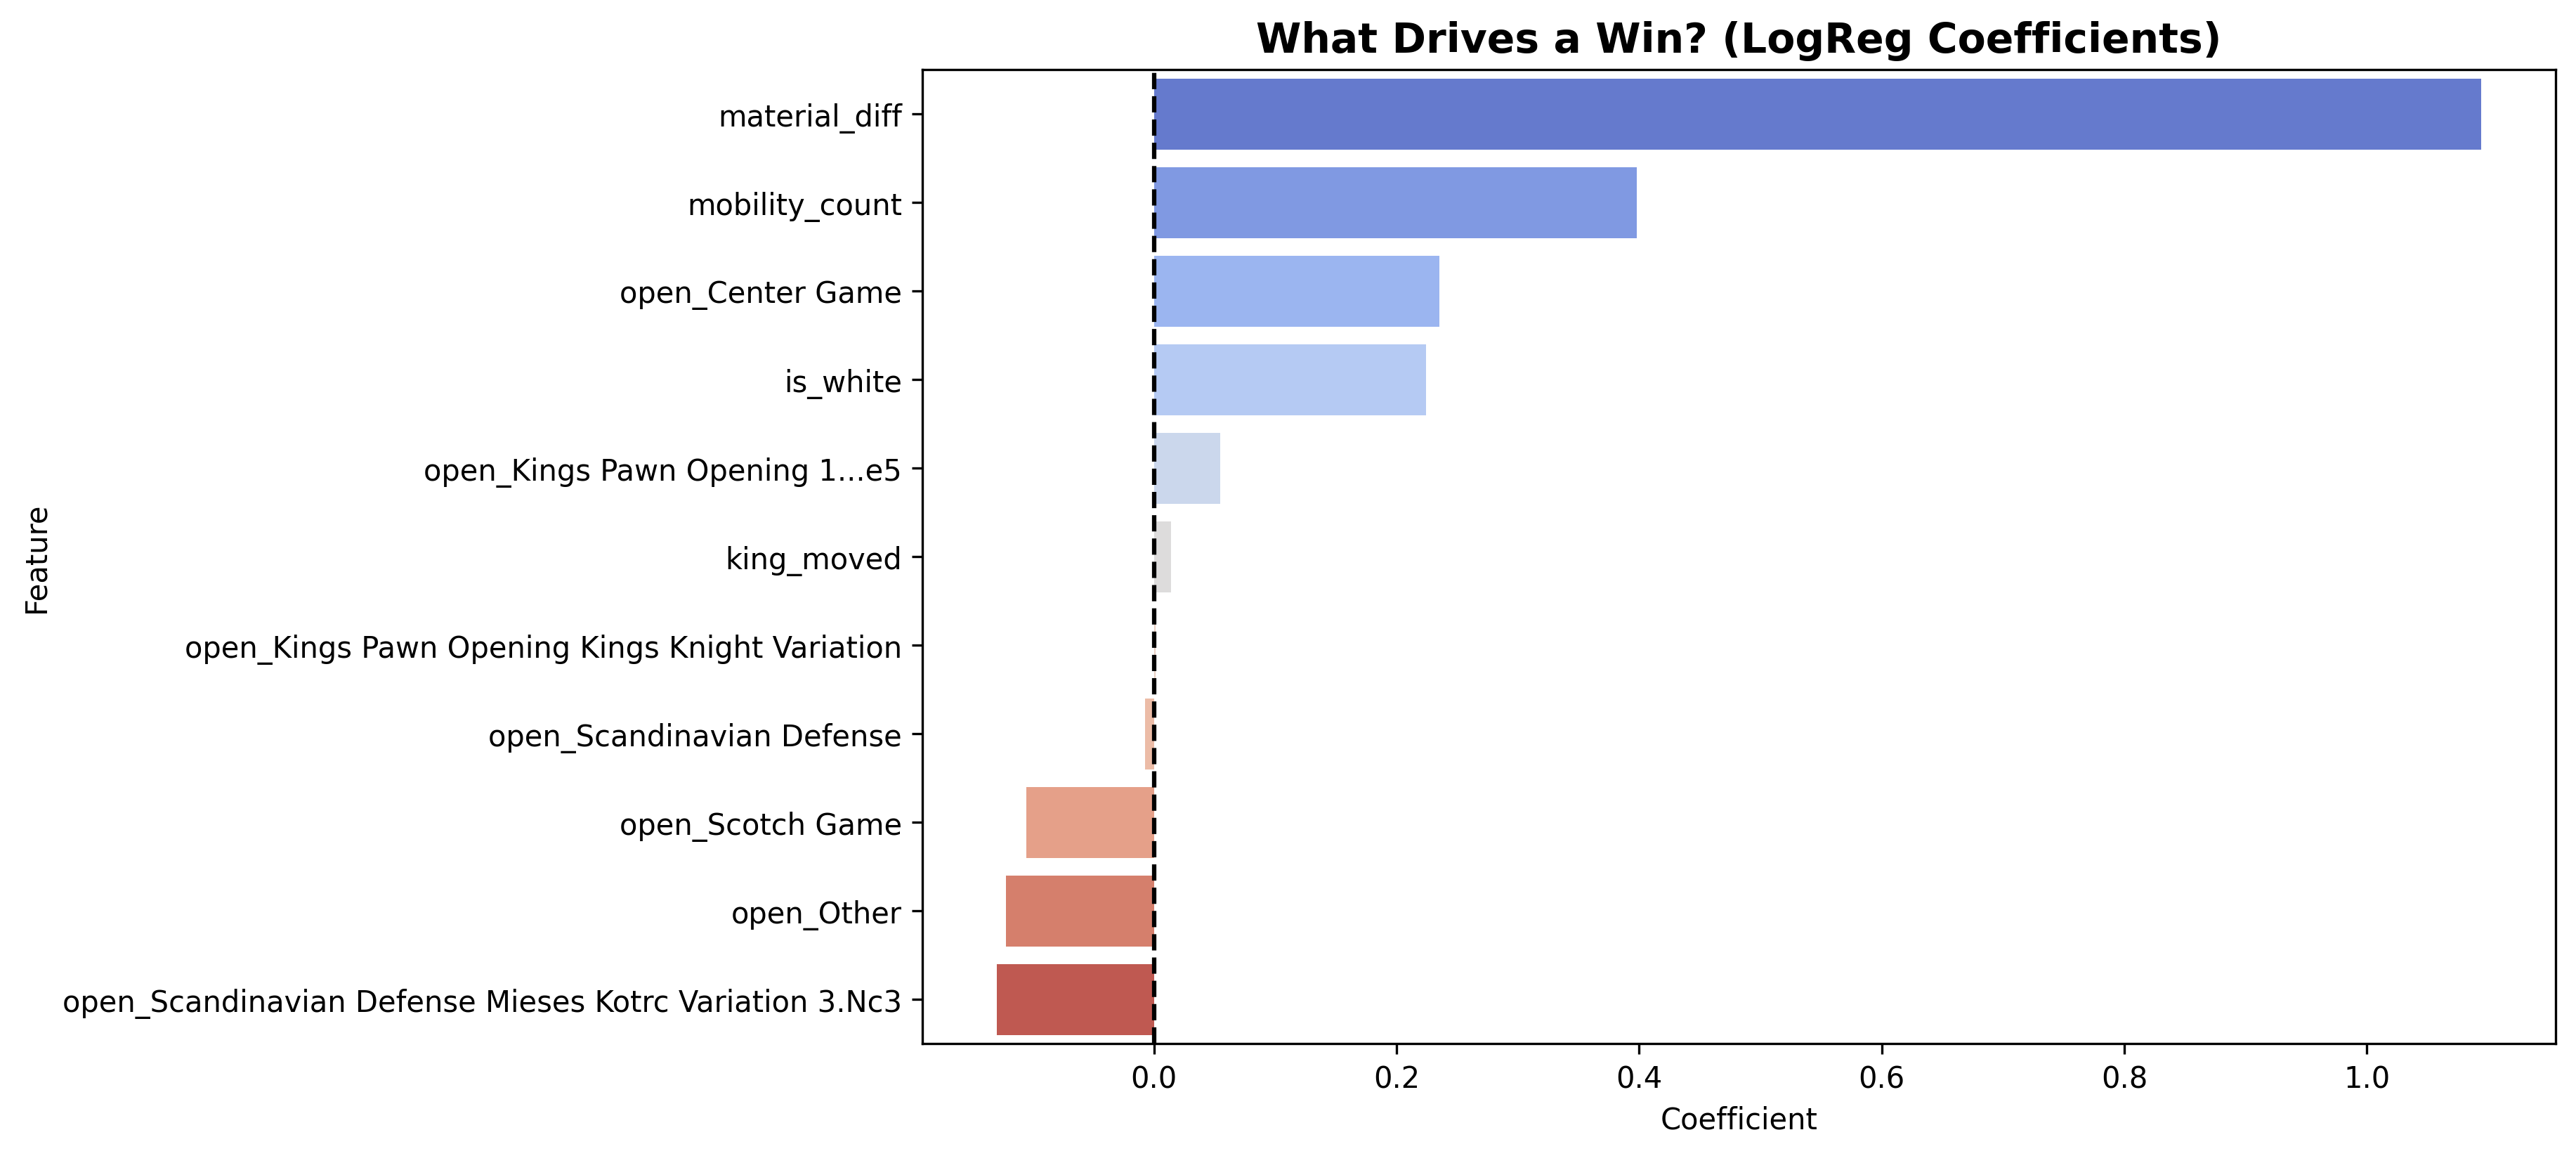
- Material (Coeff > 1.0): The dominant factor. Being up a pawn at Move 15 is the surest predictor of a win.
- Mobility: Active pieces matter, but are secondary to raw material.
- Scotch Game: This opening has a negative coefficient, statistically confirming it is a liability in my repertoire.
5.3 Deep Dive: Evaluation & Interpretation
To understand how the model predicts, I analyzed the errors using a Confusion Matrix. This reveals the “Human Element” of the games—specifically, where I deviated from statistical expectations.
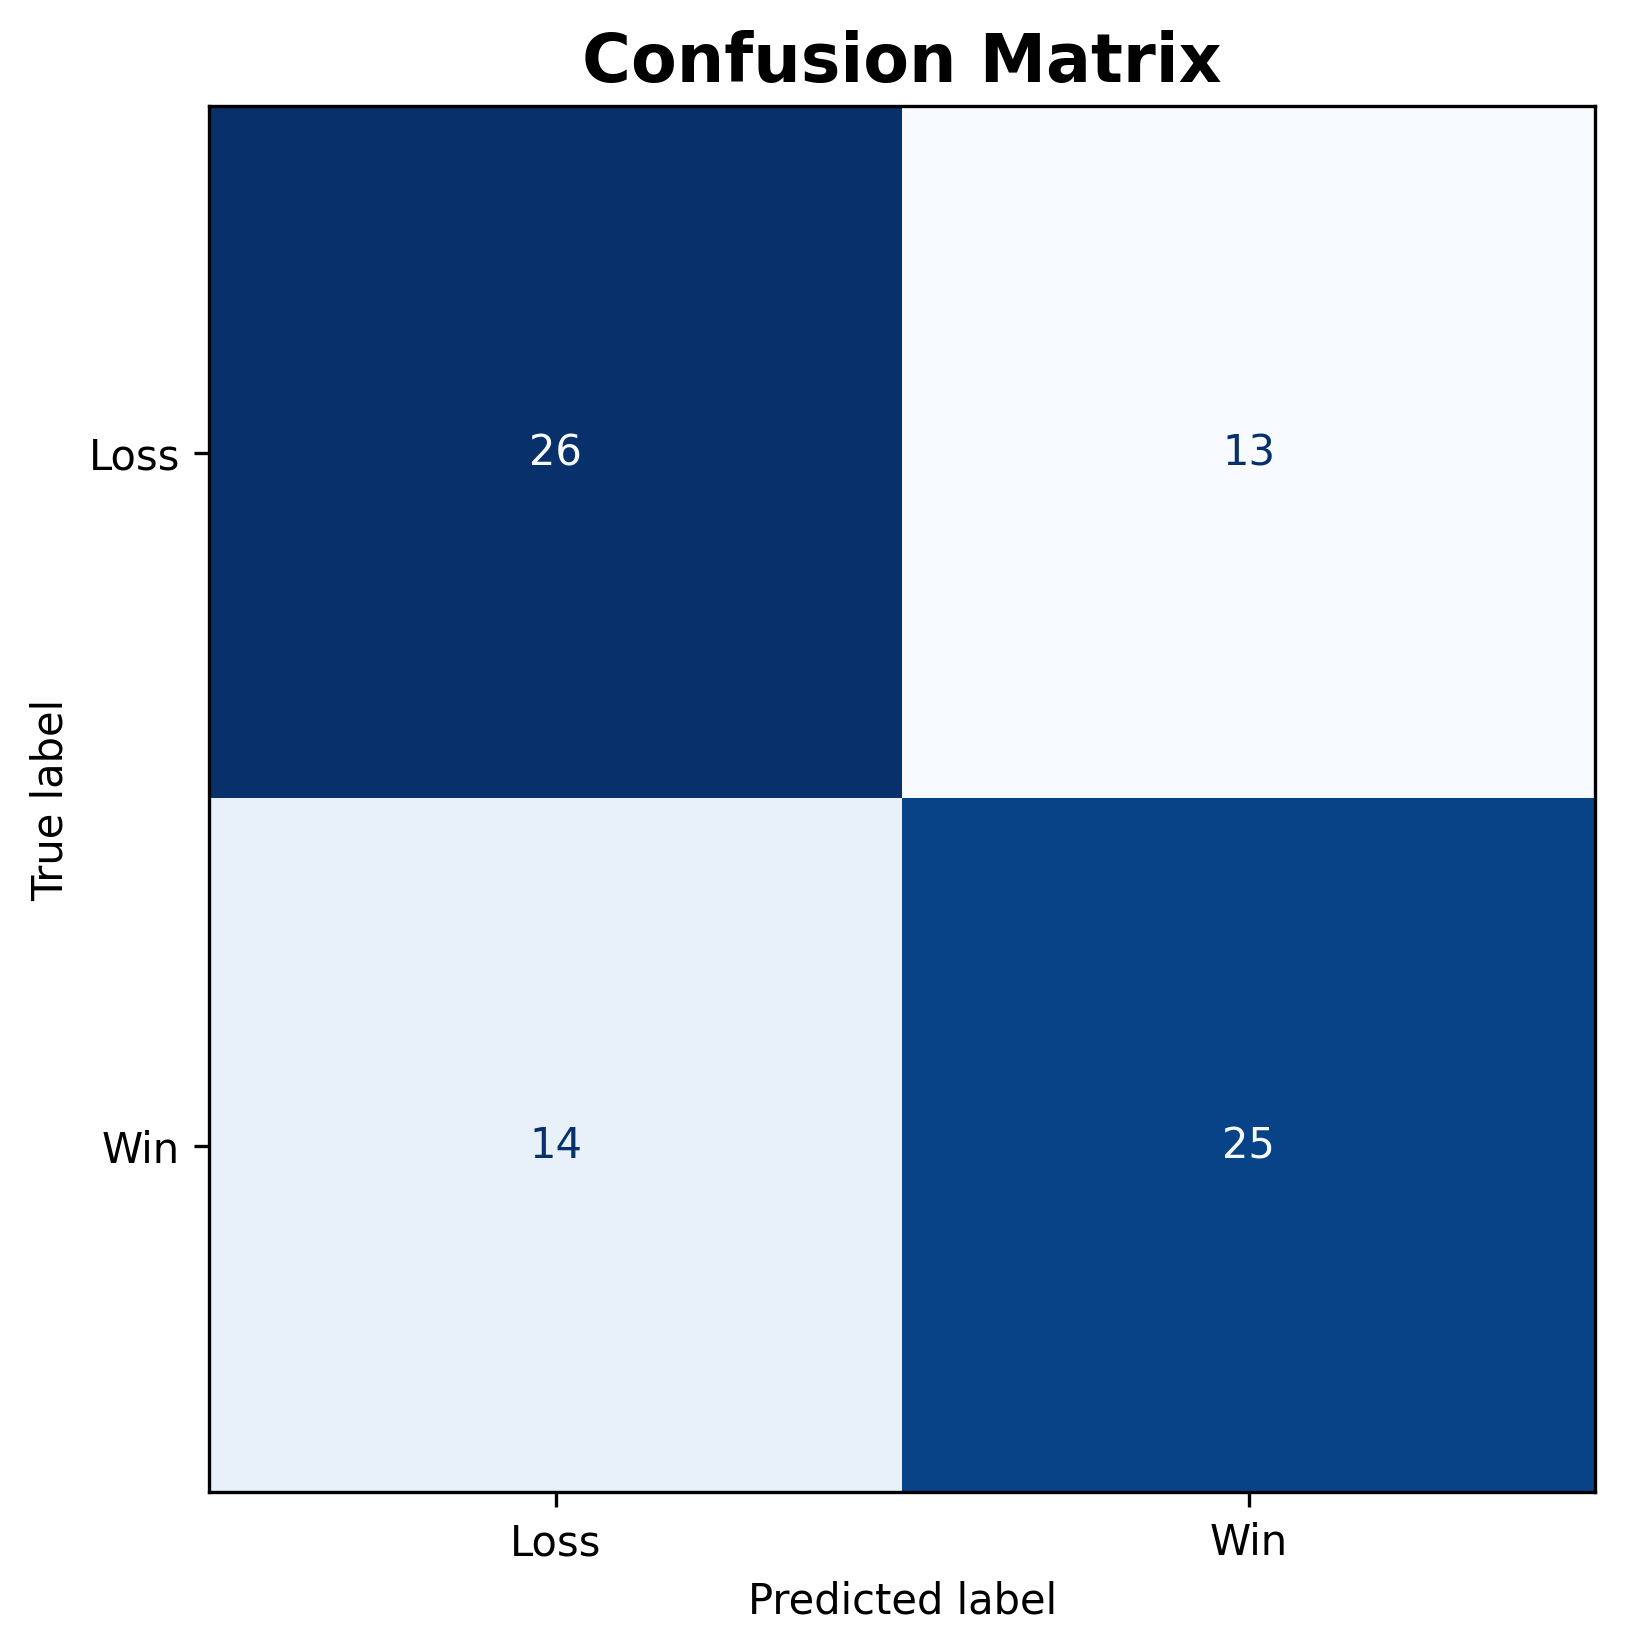
The “Chess Translation” of Errors
In this specific context, prediction errors have concrete chess meanings:
- False Positive (Predicted Win $\to$ Actual Loss): The model saw a winning board state (Material/Mobility advantage), but I lost.
- Chess Context: These are “Thrown Games” or Blunders. I had the lead but failed to convert.
- False Negative (Predicted Loss $\to$ Actual Win): The model saw a losing board state, but I won.
- Chess Context: These are “Swindles”. I fought back from a bad position, or the opponent blundered a winning advantage.
5.4 Advanced Strategy: Threshold Tuning
By default, the model predicts a Win if probability > 50%. However, I tuned this threshold to 0.20 (maximizing F1-Score) to see what happens when the model becomes “optimistic.”
| Metric | Standard Model (0.50) | Tuned Model (0.20) | Chess Interpretation |
|---|---|---|---|
| Accuracy | 65% | 63% | The standard model is more realistic about the overall outcome. |
| Win Recall | 64% | 100% | The tuned model never misses a winning chance. It catches every single game I eventually won. |
| Loss Precision | 65% | 100% | Critical Insight: When the tuned model says “Loss”, the position is statistically hopeless. I never recovered from these games. |
| Blunder Count | 13 Games | 29 Games | The tuned model highlights potential. It flagged 29 games where I had at least a 20% chance to win, but lost. |
Conclusion:
- The 0.50 Threshold is the “Realist.” It predicts the result based on my average conversion ability.
- The 0.20 Threshold is the “Coach.” It highlights Potential. It shows that in 29 games I lost, I actually had a fightable position. This confirms that tactical fragility (throwing away positions) is a larger issue than opening knowledge.
6. Interactive Dashboard (Streamlit App)
As a final deliverable, I built an interactive web application to present these findings dynamically. The app features:
- Project Story: A guided tour through the rating trends, habits analysis, and key insights.
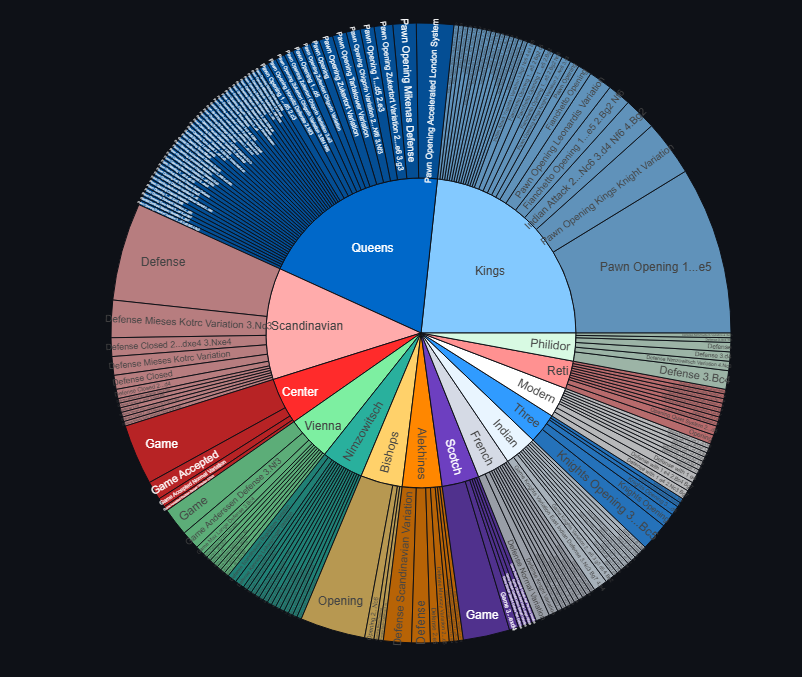
- Interactive Sunburst: A zoomable chart to explore the full depth of my opening repertoire.
- Win Predictor Demo: A live ML tool where users can input a board state (Material, Mobility, etc.) and get a real-time win probability from the trained Logistic Regression model.
7. Conclusion & Future Work
This project successfully applied Data Science to analyze chess performance.
- Tactics over Strategy: The ML results prove that Material is the primary driver of my results.
- Schedule Matters: Avoiding Late Night Friday games could instantly improve my average rating.
- Opening Repair: The Scotch Game and King’s Knight Variation are statistical weaknesses that need to be abandoned or restudied.
8. How to Run
- Clone the repository:
git clone https://github.com/moodymoeed/checkmate-with-data.git - Create and activate environment:
python -m venv venv source venv/bin/activate # Windows: venv\Scripts\activate - Install dependencies:
pip install -r requirements.txt - Run the analysis:
Open
analysis.ipynbin Jupyter Lab or VS Code and execute cells. - Run the Dashboard App:
streamlit run app.pyThe app will launch in your browser at
http://localhost:8501.
This project was conducted for the Sabanci University DSA 210 Course (Fall 2025).